
3000 Stars: This Claude Skill Dramatically Reduces Architecture Diagram Drawing Time
In October 2025, Anthropic officially launched the Claude Skills mechanism, allowing developers to package specific capabilities into reusable modules. Within a few months, the Skills ecosystem expanded rapidly. Many hoped that Skills would solve real-world problems rather than just be conceptual demos. Soon, it became apparent that most Skills were still exploring “how to be used,” with few being practical and efficient for actual implementation.
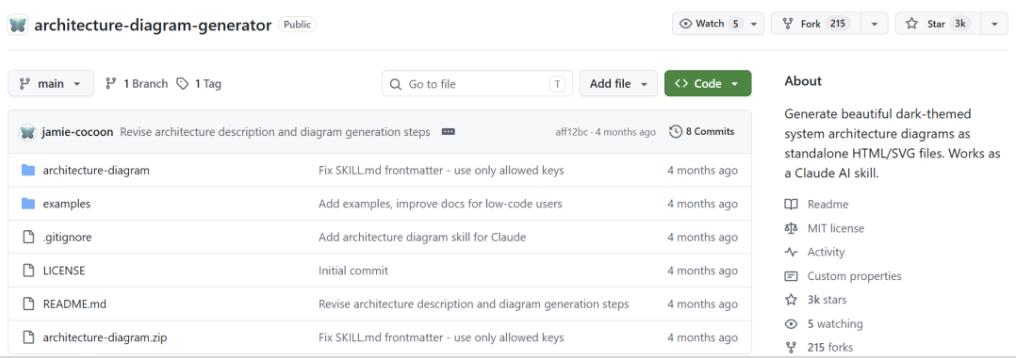
Recently, a project named Architecture Diagram Generator was open-sourced on GitHub. It takes a very direct approach, nearly reducing the barrier to drawing architecture diagrams to zero. The project has already surpassed 3000 Stars. In the Skills ecosystem, it is one of the earliest truly useful Skills.
In simple terms, the Architecture Diagram Generator is a Claude AI Skill. You describe a system’s architecture in natural language, and it generates a professional architecture diagram, output as a standalone HTML file that you can view directly in a browser. No design skills, no need to learn a drawing tool, not even any software installation is required—just the ability to type in Claude.
Key Highlight 1: Natural Language Input, No Syntax to Learn.
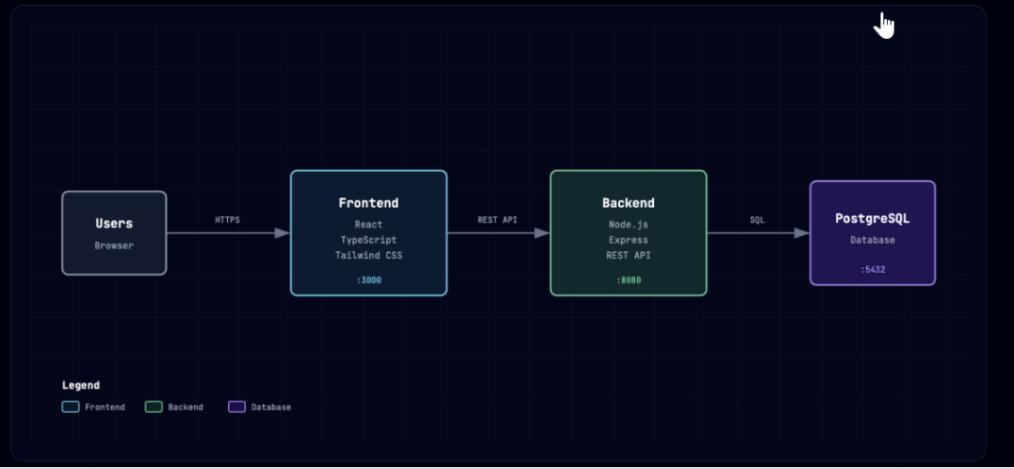
Previously, to draw an architecture diagram, you had to first learn a tool: Draw.io’s workflow, Lucidchart’s component library, Mermaid’s syntax—each had its own learning curve. This Skill’s approach: you just need to speak human language. For example, to draw a typical web app architecture, simply type in Claude: “Create an architecture diagram with a React frontend, Node.js API, PostgreSQL database, Redis cache, and JWT authentication.” Claude calls the Skill and generates a complete HTML file. Open it in a browser, and you see a clear, well-structured, color-coded diagram. The entire process requires no dragging of components or adjusting styles. You just need to describe the picture in your mind with words.
Key Highlight 2: Dark Theme, Instant Professionalism.
Most architecture diagram tools have a default white background, looking like document illustrations. The charts generated by this Skill use a Slate-950 dark background with a 40px grid pattern and JetBrains Mono font, giving a feel closer to a technical dashboard. This visual style is practical; dark backgrounds are more eye-catching in presentations and stand out in documents, lending a technical feel that makes the diagram look like a formal deliverable, not a draft.
Key Highlight 3: Single File Output, Sharing Made Extremely Simple.
The generated diagram is a single, self-contained HTML file. All styles, fonts, and SVG graphics are embedded—no external dependencies. You can simply send the file to a colleague; they can open it by double-clicking. No plugins, no account logins required—super simple. For a PDF, just use the browser’s print-to-PDF function. Sharing cost: zero.
Key Highlight 4: Semantic Coloring, Instantly Understand Component Types.
The Skill automatically assigns colors based on component types:
- Cyan: Often used for frontend, client, UI components.
- Emerald: Commonly used for backend, API, services.
- Violet: Frequently used for databases, storage, AI/ML.
- Amber: Typically used for cloud services, infrastructure.
- Rose: Applied for authentication, security, encryption scenarios.
- Slate: Used for external systems, third-party services like payment, SMS, email.
This color-coding isn’t random; it’s based on the component’s semantic role. See cyan, know it’s frontend; see violet, know it’s data layer. This consistency greatly improves readability.
Key Highlight 5: Conversational Iteration, No Redrawing for Edits.
The first generated diagram’s layout might not be perfect. Want to move the database to the right or add a protocol label to a connection? With traditional tools, you’d manually drag and adjust. With this Skill, you just continue the conversation with Claude: “Move the database to the right side, and label the connection between the API and database as ‘PostgreSQL protocol’.” Claude regenerates the HTML, and you see the changes immediately. Adjusting the diagram via chat becomes as natural as editing code. You don’t need to remember which button is where; just describe the desired change in words.
Use Cases:
The project also provides practical examples covering daily development, technical proposals, and code analysis.
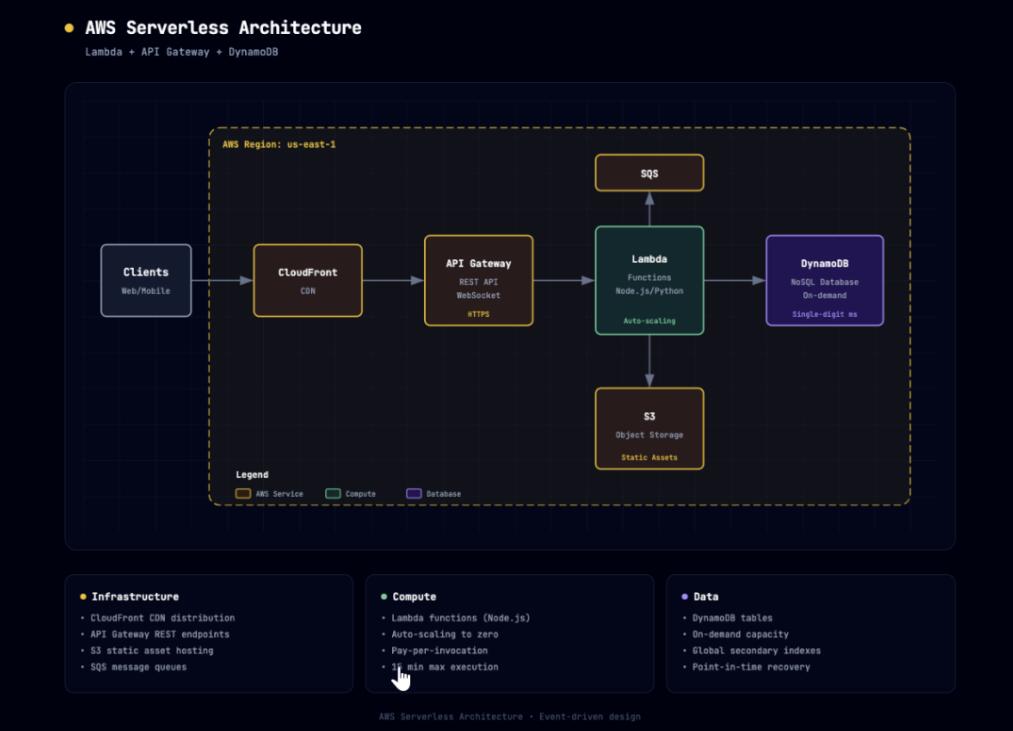
- AWS Serverless Architecture: Describe: “Create an AWS Serverless architecture diagram with CloudFront CDN, API Gateway, Lambda functions (Node.js), DynamoDB, S3 static assets, Cognito authentication.” The chart auto-colors cloud services amber, frontend cyan, database violet, presenting a clear hierarchy suitable for technical proposals, saving manual drawing time.
- Microservices Architecture: Describe a complex setup with React, mobile client, Kong API Gateway, multiple services (Go, Java, Python), PostgreSQL, MongoDB, Elasticsearch, Kafka, Kubernetes. The generated chart groups services, aggregates databases, and clearly labels queues and orchestration, with an auto-arranged layout based on data flow. What could take hours manually takes minutes for a draft, plus conversational tweaks.
- Generating Diagrams from Codebase: First, use another AI tool (like Cursor or Claude Code) to analyze your codebase and output an architecture description list. Then, paste that into Claude with this Skill, adding: “Use the architecture diagram Skill to generate a diagram from this description.” This creates a direct path from code to diagram.
How to Use:
You need a Claude Pro, Max, Team, or Enterprise plan (free tier cannot use Skills currently).
- Download the
architecture-diagram.zipfile from GitHub. - Go to claude.ai, navigate to Settings > Capabilities > Skills.
- Click ‘+ Add’, upload the ZIP file, and enable the Skill.
Usage:
In Claude, use a prompt like: “Use your architecture diagram Skill to create a diagram, described as follows: [Your architecture description].” Claude generates an HTML file; download and open it in a browser. If the layout isn’t perfect, continue the chat: “Move the database to the bottom right,” “Add an HTTPS label to this connection,” “Group these three services into a security group.”
Limitations to Note:
- Platform Lock-in: Only works within Claude.ai and Claude Code, not on other AI platforms like ChatGPT.
- Feature Set: Charts are static, not supporting real-time multi-user collaboration. For team whiteboarding, use Miro or FigJam.
- Scale: Very large diagrams (dozens of components) can result in a large HTML file, though opening speed is usually fine.
- Customization: Currently uses a fixed 6-color scheme; custom component icons or colors are not supported. For specific visual needs, you might need to manually edit the generated HTML.
Conclusion
From Visio to Draw.io, Lucidchart to Mermaid, the vision of “making it easier for developers to draw architecture diagrams” has been discussed for years. But most previous solutions couldn’t avoid two issues: either requiring learning a tool or manual operation. Architecture Diagram Generator attempts a different path. It doesn’t create a new drawing tool but packages the capability as a Claude Skill, letting users complete the work in the familiar chat interface. Technically, the single-file HTML output, zero dependencies, and semantic color coding maximize the tool’s value while minimizing the cost of use. What it changes might not just be “drawing architecture diagrams” but the way technical diagrams are generated. You no longer need to learn how to use each drawing tool; you just tell the AI what you want.
The project is open-sourced under the MIT license, allowing commercial use and modification. If interested, give it a try.
Open Source Address: https://github.com/Cocoon-AI/architecture-diagram-generator

